Today we release the first of a series of blog posts that outlines how artificial intelligence (AI) assists in the process of maintaining ESCO. The maintenance of an occupations and skills taxonomy like ESCO is a challenging and labour-intensive process. With this series of blog posts, the European Commission aims to provide more information on the ongoing work and practices adopted to ensure the consistency of the ESCO pillars and the accuracy of relations across occupations and skills.
A closer look at the ESCO occupations pillar
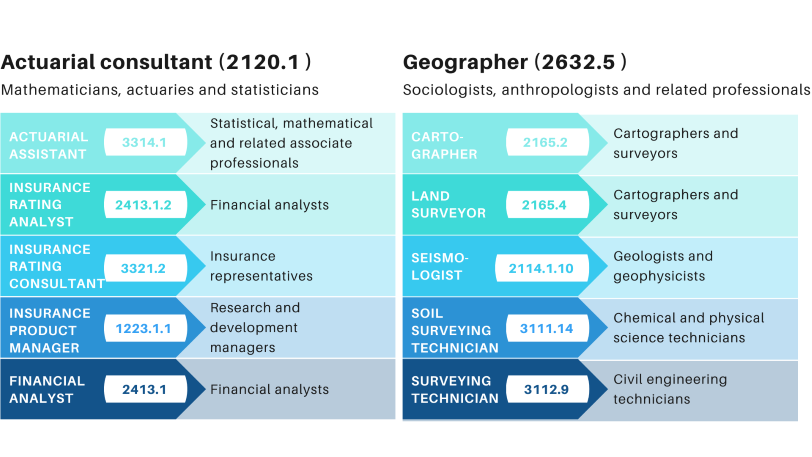
The ESCO occupations pillar follows the ISCO classification up to the level of so-called Unit Groups. ESCO supplements these Unit Groups with more narrow occupations. For example, Unit Group ‘2120 - Mathematicians, actuaries and statisticians’ contains occupations ‘demographer’ , ‘actuarial consultant’ , ‘mathematician’ and ‘statistician’ of which the latter has a sub-occupation ‘biometrician’ .
ESCO has been developed by experts and designed following a top-down hierarchical structure. But can we represent ESCO data in a different way to gain further insights? To answer this question, we are investigating the use of AI, and in particular representation learning.
To date, the ESCO occupations pillar is a manually built taxonomy based on input from labour markets experts. On the other hand, the relatedness between occupations can be estimated or derived from different data sources, which give a different perspective and can add valuable information when combined. For the results presented in this series, the ESCO data science team used the following sources: labour market expert input, national taxonomies, Qualification Data Register qualifications and job vacancies.
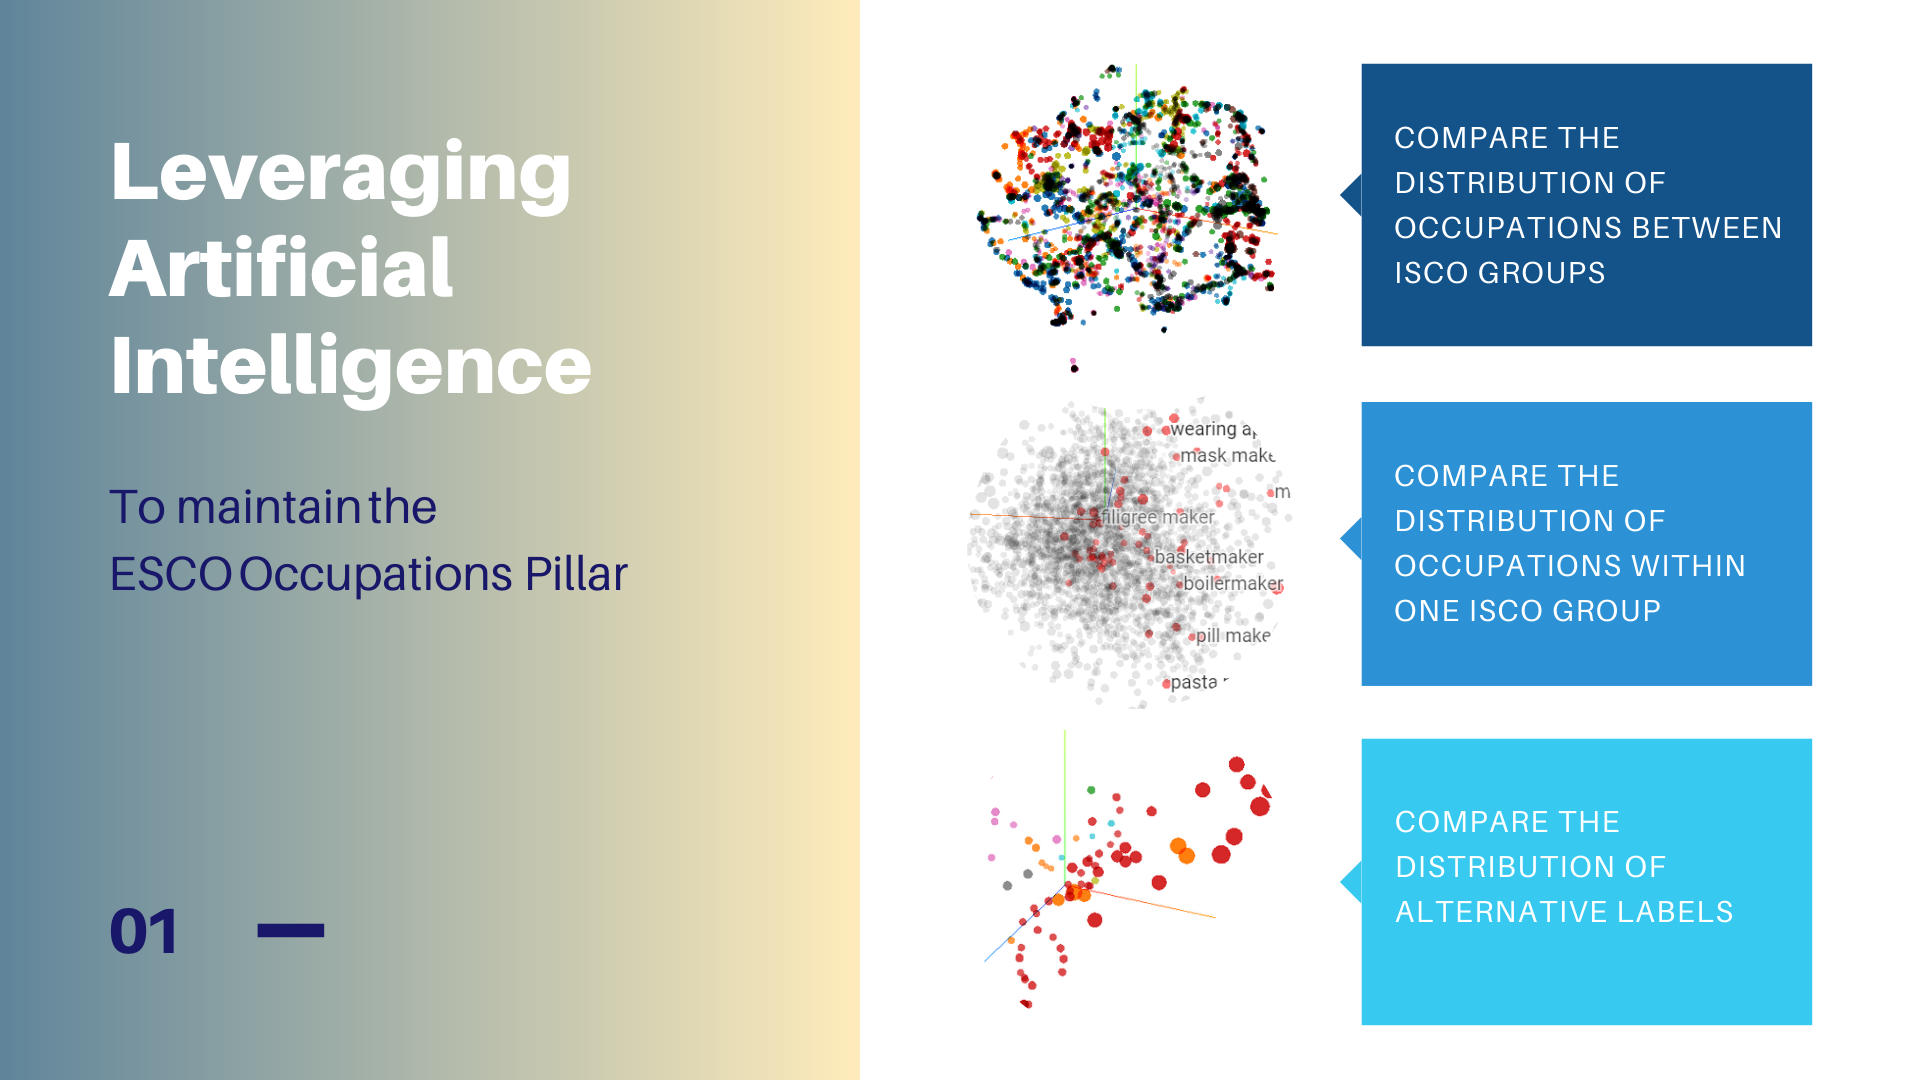
Crossing Unit Groups through artificial intelligence
The figure below shows related occupations for the ‘actuarial consultant’ and ‘geographer’ occupations using the representation learning model approach. The results demonstrate that occupations are not only related to other occupations in the same ISCO Unit, but also to occupations mapped in different ISCO groups. The first example shows the connection between the occupations ‘actuaries’ and ‘financial risk analysts’ in insurance and banking. The second example shows cross ISCO group relatedness between ‘geographer’ and ‘cartographers and surveyors’.
This data-driven AI approach offers the opportunity to investigate the top-down ESCO occupations structure and keep it closely aligned with the dynamics of the labour market. In this way, ESCO can be further improved based on evidence extracted from different data sources.
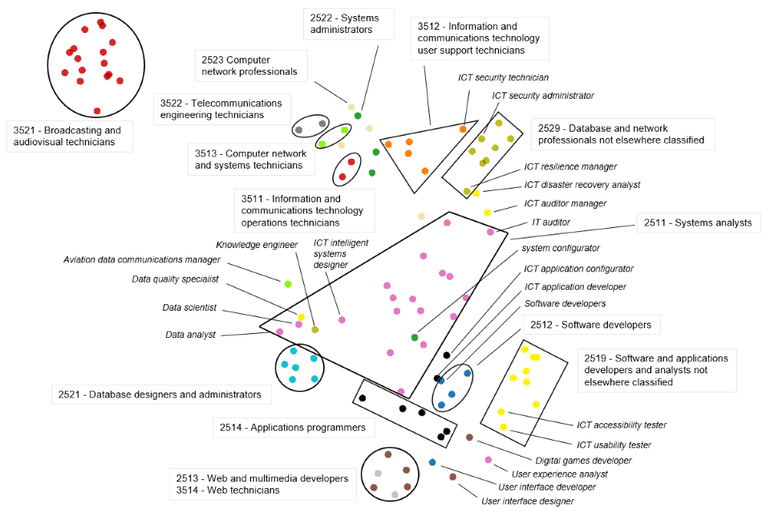
In order to show one example of this bottom-up approach, we analysed ICT professionals and technicians. We selected ISCO groups ‘25 - Information and communications technology professionals’ and ‘35 - Information and communications technicians’, which combined consist of 15 Unit Groups and 87 occupations. The following figure clusters these occupations in a two-dimensional environment, where occupations belonging to the same ISCO group are labelled with the same colour. This clustering result is particularly useful to understand where the ESCO occupations pillar closely follows the structure extracted from labour market data and where it deviates.
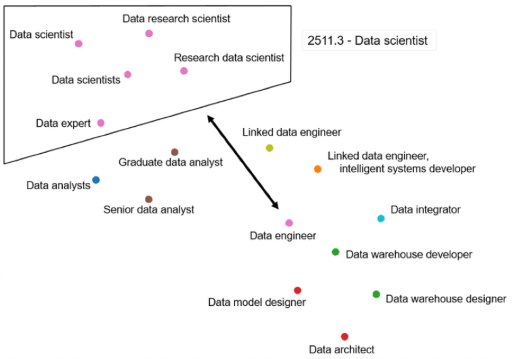
While the results above were obtained at the level of ESCO occupations, it is also possible to analyse at the lowest level of so-called alternative labels within a single occupation.
We selected the occupation ‘data scientist’ and its alternative label ‘data engineer’ and computed their closest alternative labels from all ESCO occupations. The top matches for both are visualised in the figure below. This result confirms which alternative labels are more related to the ‘data scientist’ occupation, and which ones can be considered as outliers. This algorithmic approach represents an efficient way to flag cases that require closer inspection by labour market experts and, if necessary, updates to the ESCO taxonomy.
Relevant insights can help in understanding trends and discrepancies in the distribution of occupations among ISCO levels.
This last example provides a visualisation of all occupations from ISCO level ‘2 - Professionals’. When comparing the various ISCO Sub-major Groups, we notice differences in the relatedness of occupations belonging to the same ISCO Sub-major Group. For example, the occupations belonging to ‘22 - Health Professionals’ (labelled in brown) are visibly more closely related compared to the occupations belonging to ‘26 - Legal, Social and Cultural Professionals’ (labelled in grey) as the latter group shows more variability.
Overall, in this blog post we have illustrated how the European Commission is using artificial intelligence in order to assist in shaping the future versions of ESCO. This approach has shown great potential in providing insights which, in combination with input from labour market experts, assist in the process of updating the taxonomy. More detailed information is available in the report below.
In the next blog post, we will further detail how artificial intelligence can be used to extend and enrich ESCO.
Learn more:
Technical Report
The Technical Report provides more information on this topic.